A case study with the weather visualization app
aiseed-weather
"Python only," "declarative," and "cross-platform GUI" — Flet delivers all three for real, and as a UI stack for line-of-business software it reclaims the productivity Visual Basic 6 once had, on a modern foundation.
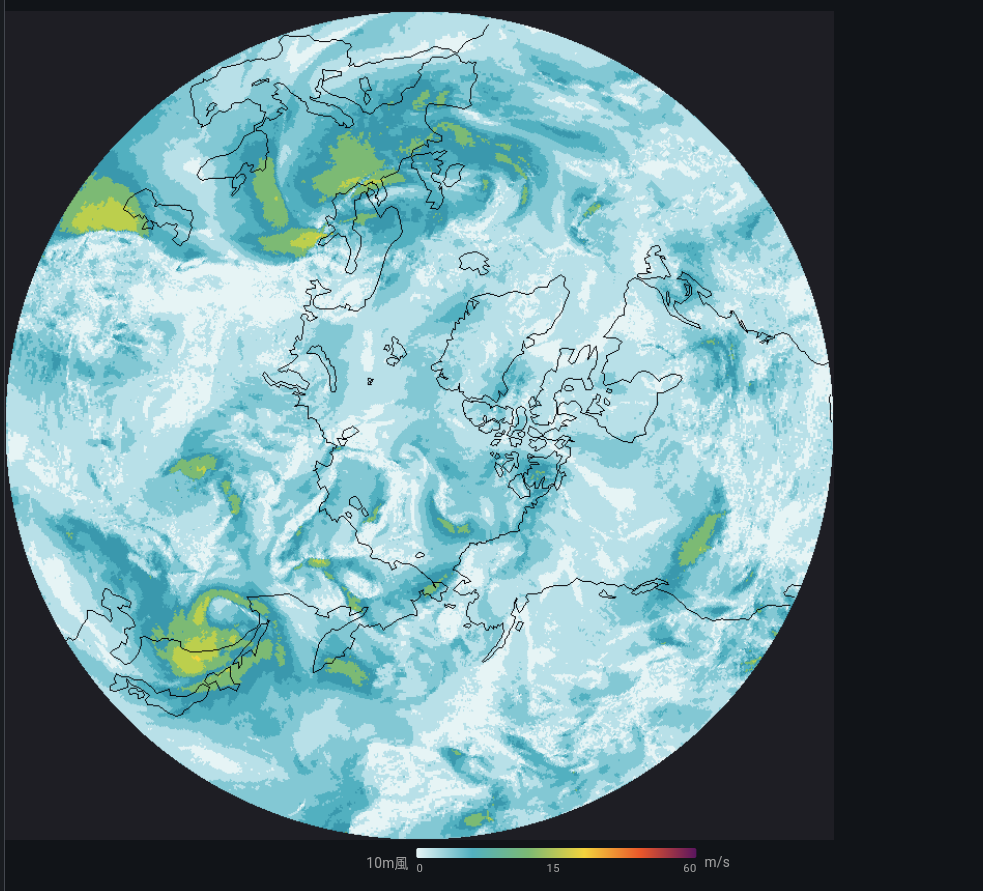
Rather than speaking in the abstract, this article uses an actual
mid-size app — aiseed-weather (a weather studio integrating JMA,
ECMWF, and Open-Meteo; Flet 0.85 + Python 3.13; 6,800 lines of
components, 3,200 lines of figure rendering) — to show what Flet
actually solves for business GUIs.
※ Code excerpts may have evolved further in subsequent development.
App layout
src/aiseed_weather/
                ├── components/        # Flet components (UI)
                │   ├── app.py             ← root + navigation
                │   ├── point_forecast_view.py  ← point forecast tab (2,000 lines)
                │   ├── map_view.py             ← weather map tab (3,300 lines)
                │   ├── radar_view.py           ← radar tab
                │   └── amedas_view.py          ← AMeDAS observation tab
                ├── figures/           # chart rendering with matplotlib + flet.canvas
                ├── services/          # access layers for ECMWF / ERA5 / JMA / Open-Meteo
                └── models/            # dataclasses / settings
UI, data fetching, and data processing are all written in Python. There is no Web/REST API layer in between — polars DataFrames are handed directly to Flet components.
1. Declarative components — React Hooks–style, Python-native
In Flet 0.70+'s declarative mode, a function decorated with
@ft.component becomes a component, and you use hooks like
ft.use_state / ft.use_effect / ft.use_ref just as you would in
React.
The point forecast view of aiseed-weather (excerpted from real code):
@ft.component
                def PointForecastView(settings: UserSettings):
                    data_dir = resolved_data_dir(settings)
                    locations, set_locations = ft.use_state(load_locations(data_dir))
                    selected_name, set_selected_name = ft.use_state(settings.default_location)

                    forecast_state, set_forecast_state = ft.use_state("idle")
                    forecast_data, set_forecast_data = ft.use_state(None)
                    error_msg, set_error_msg = ft.use_state("")

                    variable, set_variable = ft.use_state("temperature_2m")
                    visible_days, set_visible_days = ft.use_state(7)
                    pan_offset_h, set_pan_offset_h = ft.use_state(0)
                    # … (in the real code there are 30+ use_state slots)
Location list, currently selected location, load state, forecast data,
error message, displayed variable, time range, pan offset… every
piece of state in this business UI is handled with local use_state
alone. No Redux, no Context Provider, no Zustand.
    async def fetch_forecast(_):
                        set_forecast_state("loading")
                        try:
                            df = await fetch_open_meteo(lat, lon, ...)
                            set_forecast_data(df)
                            set_forecast_state("ready")
                        except Exception as e:
                            set_error_msg(str(e))
                            set_forecast_state("error")

                    return ft.Column([
                        ft.Dropdown(
                            value=selected_name,
                            options=[ft.DropdownOption(loc.name) for loc in locations],
                            on_change=lambda e: set_selected_name(e.value),
                        ),
                        ft.FilledButton("Update", on_click=fetch_forecast),
                        _StatusBanner(forecast_state, error_msg),
                        _HourlyStrip(forecast_data) if forecast_data else None,
                        _Chart(forecast_data, variable, visible_days, pan_offset_h),
                    ])
That's the entire component. Think of it as VB's Button1_Click
substituted directly into on_click=. The modern improvement is that
async def handlers are accepted as-is.
2. Reactive shared state — @ft.observable
For state that needs to outlive a single tab — like a long-running
download — use a dataclass annotated with @ft.observable. This is
how aiseed-weather's map tab propagates progress across the entire
screen while ECMWF GRIB2 files (tens of MB each) are downloaded in
parallel from S3:
@ft.observable
                @dataclass
                class FetchSession:
                    """Lifecycle state for an ECMWF Open Data download.
                    Survives tab switches; subscribed to by every component."""
                    running: bool = False
                    items: list = field(default_factory=list)
                    progress: dict = field(default_factory=lambda: {"done": 0, "total": 0})
                    status_text: str = ""
Just writing session.running = True triggers automatic re-render in
every component that reads it via use_state. Conceptually similar
to Recoil / Jotai in React, but it's a Flet built-in — no extra library
needed.
The common business-app scenario where "a long job is running in the background, and the status bar, progress bar, and button enable/disable state all need to stay in sync" is solved with zero wiring code.
3. Drawing vector charts in pure Python — flet.canvas
Custom charts are a constant in business apps. aiseed-weather
originally pasted matplotlib output into an ft.Image, but to add
hover and click interaction later we rewrote it using flet.canvas.
That gave us 650 lines that overlay 5 variables × HRES + MSM +
climatology + ensemble band:
import flet.canvas as cv

                shapes: list[cv.Shape] = []

                # Climatology band (p25 – p75)
                shapes.append(cv.Path(
                    elements=band_path_elements,
                    paint=ft.Paint(color="#d8e4f5", style=ft.PaintingStyle.FILL),
                ))

                # HRES line
                shapes.append(cv.Path(
                    elements=hres_line_elements,
                    paint=ft.Paint(color="#234b86", stroke_width=2.0,
                                   style=ft.PaintingStyle.STROKE),
                ))

                # Axis labels
                for tick in time_ticks:
                    shapes.append(cv.Line(x, pad_t, x, pad_t + plot_h,
                                          paint=ft.Paint(color="#cccccc")))
                    shapes.append(cv.Text(x, pad_t + plot_h + 14, label,
                                          style=ft.TextStyle(size=10)))

                return cv.Canvas(shapes=shapes, width=W, height=H)
What would require d3.js / Recharts / Plotly plus a data-shaping
layer on a web frontend is done entirely in Python. The polars
DataFrame that holds the source data feeds Canvas Path elements
directly. "The language for processing the data and the language for
drawing it are the same" — a property that pays off slowly but
consistently in business development.
4. A separate path for exports — matplotlib in the same codebase
The on-screen view is flet.canvas, but when the user clicks the "PNG
download" button, the output is generated with matplotlib:
fig, ax = plt.subplots(figsize=(10, 6))
                ax.plot(times, temperatures, label="HRES")
                ax.fill_between(times, p25, p75, alpha=0.3, label="Climatology range")
                fig.savefig(path, dpi=150, metadata={"Source": "ECMWF Open Data / ..."})
Different engines for interactive and export use — but both are Python, so adding a variable or unifying colors is a one-place change. The familiar web-app fracture of "React for the screen, separate backend with Pillow for output" doesn't happen here.
5. Native async I/O — asyncio just works
Downloading GRIB2 files from ECMWF's S3 is network-bound and benefits
from parallelism. We call asyncio.TaskGroup + httpx.AsyncClient
directly from a Flet event handler:
async def on_fetch(_):
                    session.running = True  # every component updates automatically
                    try:
                        async with asyncio.TaskGroup() as tg:
                            for param in params:
                                tg.create_task(download_one(param, session))
                    except* asyncio.CancelledError:
                        session.status_text = "Cancelled"
                    finally:
                        session.running = False
No DoEvents hell from the VB 6 era. No IPC wiring hell from
Electron. Native Python async meshes naturally with the UI update
cycle.
6. Native dependencies are fine — miniforge / conda-forge
Business apps frequently need to call C libraries from Python.
aiseed-weather uses:
- cartopy — geographic projections (C++ + PROJ + GEOS)
- cfgrib — GRIB2 reading (eccodes / C library)
- xarray + dask — multi-dimensional array processing
These are painful to set up with pip, but with miniforge a single
environment.yml covers everything:
dependencies:
                  - python=3.13
                  - flet>=0.85
                  - polars
                  - xarray
                  - cfgrib
                  - cartopy
                  - matplotlib
mamba env create --prefix ./.venv -f environment.yml
                mamba activate ./.venv
                flet run src/aiseed_weather/main.py
Flet does not collide with the scientific Python stack. This is exactly the territory where Electron-based tooling becomes hellish (per-OS native builds), and where the Python + conda combination's strengths come through directly.
7. Distribution is one command
flet pack src/aiseed_weather/main.py  # single binary
                flet build apk                         # Android
                flet build web                         # PWA
The same codebase produces desktop, web, and mobile builds. In business SI work, "same tool on the corporate web and on field tablets" is a constant requirement — this is effectively a killer feature.
8. It also shines for embedded and dedicated business terminals
Flet's strength as a business GUI isn't limited to desktop and web. Because the Flutter-based renderer uses the GPU directly, it runs smoothly even on ARM-board-class hardware. That's a critical property for the world of dedicated business terminals.
Likely use cases
- Factory HMIs (touch panels next to production lines)
- Warehouse handheld terminals (Android tablets + barcode pistols)
- POS / reception terminals / kiosks
- Operator panels for inspection equipment (scales, cameras, PLCs)
- In-vehicle / marine secondary displays
- Lab instrument GUIs (via serial / GPIB / Modbus)
Why Flet fits
| Requirement | How Flet handles it |
|---|---|
| Runs on Raspberry Pi 4/5 etc. | If Flutter Linux desktop runs, you're set. Many examples in the wild. |
| Touch-first UI | Flutter / Material is designed touch-first |
| Kiosk mode (full-screen, no window chrome) | page.window.full_screen = True — one line |
| Talking to hardware (GPIO / serial / CAN / Modbus / OPC-UA) | Standard Python libraries work as-is (pyserial, pymodbus, python-can, asyncua, …) |
| Image processing / inference on the same machine | OpenCV, PyTorch, ONNX Runtime, TFLite — all from Python |
| Per-site customization | Swap a line of code and redeploy; no build chain |
| Want to view monitoring on the web too | Same code with flet run --web — terminal-side and remote monitoring dashboard from one source |
What aiseed-weather implies by analogy
This app is written as "an analysis tool that runs on a PC," but the same code, dropped onto a Raspberry Pi 5 + 7" touch display in kiosk mode, instantly becomes a weather-display terminal.
def main(page: ft.Page):
                    page.window.full_screen = True
                    page.window.frameless = True
                    page.theme_mode = ft.ThemeMode.DARK  # better night legibility
                    page.padding = 0
                    page.add(App())

                ft.run(main)
Add three lines and the "dedicated business terminal" shell is in place. matplotlib charts render smoothly at 60 fps even on a Pi 5. That's a subtle but powerful Flet advantage.
What stands out most is that "the firmware for the terminal and the web dashboard for remotely monitoring it become a single source". For business IoT shops that have always built monitoring web apps with a separate team, this is a structural change to how development teams are organized.
Weak spots
- Memory footprint includes the Flutter runtime (around 200 MB resident on embedded Linux). MCU class is out of reach — that's LVGL's domain.
- Very small displays like 320×240 are out of scope.
- Hard real-time control loops should be split into a separate process — the standard pattern is "Flet for UI, separate Python process or C for control, talk via IPC."
For the zone of "Raspberry Pi class or above + touch panel + business logic," Flet may well end up dominant.
Reports and printing are actually a strength too — the Excel template approach
"Generating reports" — unavoidable in business apps — is not a Flet weakness; it's traditional Python turf. Excel-based reports, de facto in many business environments (especially in Japan), can be generated by filling values into a template:
from openpyxl import load_workbook

                wb = load_workbook("template/monthly_report.xlsx")
                ws = wb["Summary"]
                ws["B3"] = report_date
                ws["D5"] = total_count
                for i, row in enumerate(df.iter_rows(named=True), start=10):
                    ws.cell(i, 1, row["station"])
                    ws.cell(i, 2, row["t_max"])
                    ws.cell(i, 3, row["t_min"])
                wb.save(output_path)
Formatting, borders, print ranges, headers/footers, and company-seal images are all baked into the template; Python just fills in values. Accounting and admin staff on site can edit the template directly in Excel, so it slots into operations easily.
Output pipelines you can choose from:
| Output | Library | Use case |
|---|---|---|
| Excel (.xlsx) template fill-in | openpyxl |
monthly reports, line items, quotes |
| Excel + charts / conditional formatting | xlsxwriter |
tabulations with charts |
| Word (.docx) templates | python-docx, docxtpl |
contracts, reports |
| PDF (low level) | reportlab |
fixed-layout legal documents |
| HTML → PDF | weasyprint |
reports laid out in CSS |
| Direct-to-printer | win32print (Win), cups (Linux) |
labels, receipts |
The Flet component side is a single button:
ft.FilledButton(
                    "Export Report",
                    icon=ft.Icons.PRINT,
                    on_click=lambda _: export_excel(data, settings.template_path),
                )
Same pattern as aiseed-weather's "PNG download" — different engines
for screen display and output files, both in Python, both inside one
codebase.
Synergy with AI-assisted coding
The traits described above come into their own when combined with
AI-assisted coding. The 6,800 lines of UI code in aiseed-weather
were written almost entirely through conversation with Claude Code.
The human side did the parts that matter: deciding what to build, what
the data means, and reviewing what came back.
The reasons Flet is structurally AI-friendly:
- Python — the language LLMs are best at
- A small, consistently-named API surface (
ft.Column/ft.Row/ft.Container/ft.Text…) - Declarative, so state → UI is a one-way dataflow — the procedural "when do I update what" judgments that confuse LLMs never come up
- No HTML/CSS/JS in sight — no cross-domain consistency to police (CSS selector collisions, Tailwind class names, React key declarations, etc.)
The result: "write a dataclass and a component that displays it" gets you Flet code that runs with almost no edits. The multiple round-trips of "rewrite the TypeScript type," "Tailwind isn't applying," "you need a useMemo" that come with web frontend work collapse into a single turn with Flet.
On top of that, project-specific coding conventions can ride along in
the repository so the AI always sees them (Claude Code's Skills
mechanism, for example). Once you write down "we use Flet 0.85+
declarative mode only; page.update() is forbidden," the AI will not
pick up older patterns from web search results. Flet's declarative
mode being easy to write conventions for, and LLM code generation
being good, combine multiplicatively here.
(The broader topic of "running conventions through the AI" as a business SI organizational practice is a separate article — to come. Pushing Python hot spots into Rust via PyO3 is also coming as a separate piece.)
Compared to Visual Basic — what carried over, what got modernized
| VB 6 | Flet + Python | |
|---|---|---|
| Learning curve | Low | Equally low (if you read Python, a day is enough) |
| GUI placement | Form designer | Code (Git, reviews, great fit with AI generation) |
| Event-driven model | Button1_Click |
on_click=fn (async OK) |
| State management | Global variables + form scope | use_state + @ft.observable |
| Numerical computing | Roll your own / Excel interop | numpy / polars / xarray, standard |
| Visualization | MSChart, ActiveX | matplotlib / flet.canvas / Plotly |
| Networking | WinINet, Winsock | httpx, asyncio, gRPC, etc. |
| Distribution | EXE | EXE / Web / iOS / Android / embedded terminals |
| Runtime targets | Windows only | Win / Mac / Linux / Web / Mobile / Raspberry Pi |
| Ecosystem | Business ActiveX | The entire Python package ecosystem |
VB 6's productivity rested on "language simplicity × form-designer immediacy × distribution simplicity." Flet performs this same three-part act in a modern setting, with Python as a powerful supporting cast.
Where it shines
Situations where, after writing aiseed-weather, Flet's strengths
struck me most:
- Internal tools that handle data — the analytics/aggregation core is in pandas / polars and you need to ship a GUI to business users
- Putting ML inference into production — data scientists themselves can write the screen that calls a PyTorch / scikit-learn model
- Scientific computing + visualization — embed matplotlib / Plotly expressivity directly into the UI
- Migrating off VB / VBA / Access — cross-platform without sacrificing productivity
- You bounced off Electron / Tauri — leave the JS stack overhead behind
- You want something more serious than Streamlit — degrees of freedom in state, choice of UI components, and distribution options are categorically different
- Dedicated business terminals / embedded HMIs — site-installed dedicated UIs on Raspberry Pi / Linux boards + touch panels, written in Python
Maturity status — declarative mode is officially production-ready
As of writing, the official Flet Team has stated explicitly that declarative mode is ready for real apps:
- Flet 0.85 added routing (
ft.Router) and declarative dialogs (ft.use_dialog()) — the last pieces missing for@ft.componentto be production-grade - The Flet 0.83 release notes already stated "the API is 99% stable; little will change before 1.0"
- Flet 1.0 Alpha → Beta is already public; 1.0 stable is within sight
The "it's new, let's wait and see" phase is over. If you're starting a new business app now, declarative mode is the choice.
A caveat: most older articles on the web use the imperative API
(page.add() / direct mutation). But if you're working alongside AI,
just writing "declarative mode only" into a conventions file is
enough — the AI will generate against the current API and the legacy
patterns won't leak in.
Honest weaknesses
DataTableisn't built for scrolling 10,000 rows. Virtualization is on you.- Polished mobile UX (gestures, etc.) requires some Flutter knowledge.
- Distribution binaries bundle the Flutter runtime — minimum around 30 MB.
- Most introductory articles on the web use the older imperative API.
Even so, the leverage that "writing your business GUI in Python" provides outweighs these in a broad range of situations.
Summary — "Visual Basic on top of Python" is here now
aiseed-weather was a personal test of whether Flet can carry a
mid-size, genuinely production-grade business app. The answer is a
clear YES.
- 6,800 lines of UI components
- 3,200 lines of chart rendering (
flet.canvas+ matplotlib) - 5 data sources (ECMWF / ERA5 / JMA / Open-Meteo / dynamical.org)
- Async downloads, cancellation, retries
- Publication-quality PNG/PDF export
All of this, developed in the ordinary way — in a single language, Python, with no web frontend/backend split, and without React, TypeScript, bundlers, or CSS frameworks. It also runs on a Raspberry Pi. It also ships to the web.
If VB 6 invented the "minimum-viable productivity stack for business
GUIs," Flet has reinvented it in the Python context and removed the
ceiling on where it can be distributed. Every developer who misses
VB's productivity, every data scientist who has hit Streamlit's
limits, every Python user who bounced off Electron, every SI engineer
who has built field terminals the hard way in Qt — give flet run a
try.
Official site: https://flet.dev/ / Source:
aiseed-weather